Friday Speedrun: August 2, 2024
FOR
THE BEST EXPERIENCE: READ IN BROWSER

Hello. It’s Friday. Thanks for signing up. I’m Brent Donnelly.
The About Page for Friday Speedrun is here.
Here’s what you need to know about markets and macro this week

Before we get started, check out the video about Spectra School right here. It describes our flagship course…
Think Like a Market Professional: Practical Frameworks for Financial Markets
This self-paced course will equip you with a set of robust and practical frameworks that combine logic, stories, data and more to help you see markets more clearly, make better forecasts, and make more money.
The course includes:
- 16 written lessons
- 8 Learning from Legends videos with renowned market professionals
- Behind the Screens videos covering specific topics
- Live Q&A sessions with Brent Donnelly every month
What you’ll learn about:
- History, cycles and mega trends
- Narratives, bubbles and crashes
- Economic data and central banks
- Market psychology
Course fee: $1,200.
Let’s go!
Global Macro
The yen carry blowup and weak nonfarm payrolls data from the start of August already feels like some kind of weird fever dream at this point. The NFP data came out August 2nd and here is a list of the major US economic data releases since then. I have highlighted all worse than expected releases in red, and all better-than-expected releases in green.
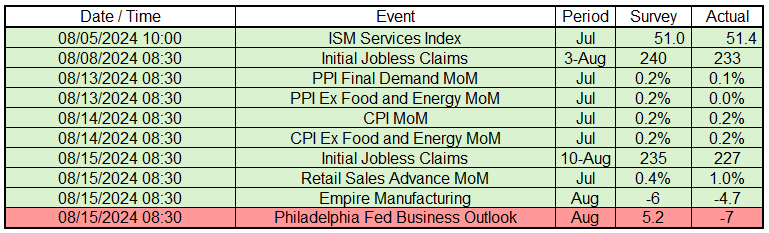
Ha! What a week. More disinflationary nirvana and nothing nefarious at all. It looks like NFP was a mutant outcome and the entire market reaction was, like Jeremy Siegel’s call for a 75bp emergency Fed cut, woefully off the mark. We all got spoofed by Manufacturing ISM and NFP and now nobody really understands what’s going on again.
And in the midst of falling Initial Claims, and continued strong Retail Sales, you got further evidence that the supply shock is over, core goods prices are in outright deflation, and services, while sticky, are not as sticky as feared. I guess it was all just a bad dream.
Meanwhile, my view was that the swing towards Harris in the polls and gambling odds would be bad for the dollar, bad for stocks, and good for bonds, but that has not been the case at all. Stocks got into such a state of abject panic that the bounceback continues unabated, even as the would-be first female US President hogs the limelight and fails to be derailed by the Elon and Don Show.
I still think a Harris presidency is bearish US growth and bearish US stocks and the dollar, but the market isn’t trading it right now. The election is 80 days away.
The other main event this week was a surprise(ish) rate cut from the Reserve Bank of New Zealand as the economy there looks increasingly at risk from very high real rates, tight policy, and falling inflation and demand. A bit more on that later.
Stocks
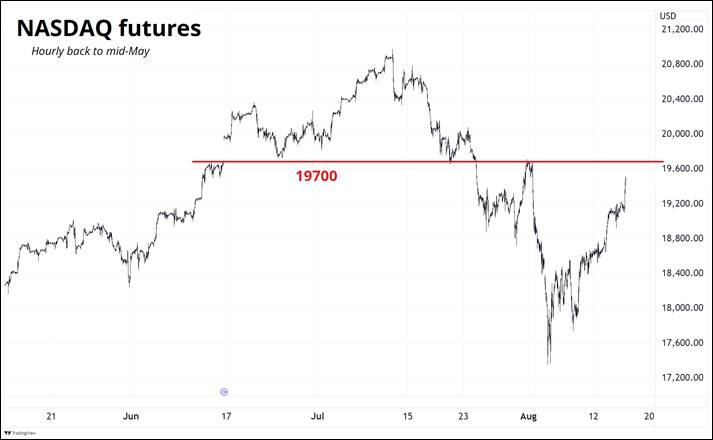
Chumbawamba blasted at full volume as the NASDAQ got knocked down, then it got up again, and is now jetpacking its way back to levels not seen since the day before that infamous nonfarm payrolls release.
You can see from the hourly chart that 19,700 is a big deal as it was a gap and hold in mid-June, a breakdown in late July, and a major high right before the Nantekotta Crash of 2024. Other technical levels have proved irrelevant so far on this explosion higher, but I’m gonna say we struggle to take out 19700 as easily.
As outlined last week, when there is a huge blowup like this, correlations move towards one, and even though calm has been restored and the VIX is less than half of thirty now, the charts are all going to look the same for a while until this crazy episode scrolls off the left hand side of the screen.
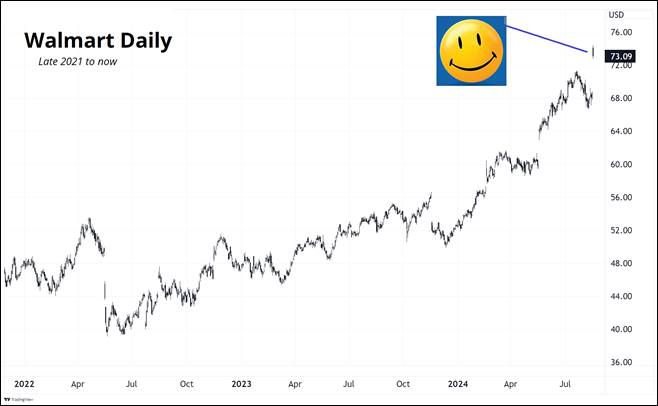
Those who like to read all economic news as bearish had a tough time Thursday as not only did Retail Sales come in super strong, Walmart raised guidance. That rosy outlook from WMT came out about an hour before the Retail Sales data and gapped the stock to a new all-time high.
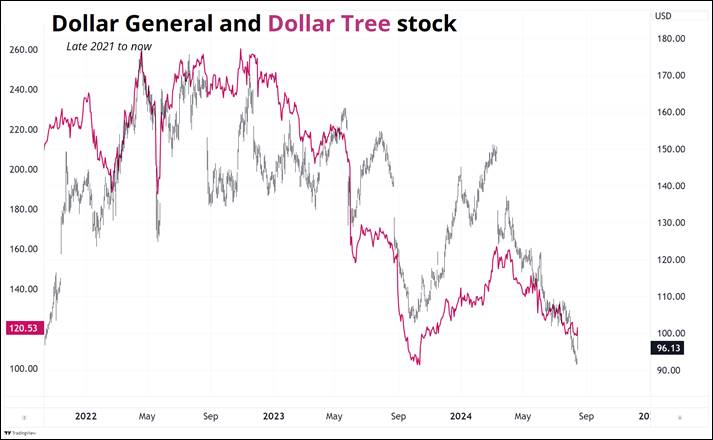
The bear argument would be that maybe everyone is just trading down to cheaper goods as excess savings run out. If that were true, one might also expect to see Dollar General and Dollar Tree stock rising, because DG and DLTR sell crap even cheaper than WMT and it’s the ultimate trading down thingy. Here they are.
Hmm. I feel like I am right back to where I was for most of 2024. I got fooled by the ISM and NFP and thought the US economy was slowing more rapidly. Now, I guess it’s not. The US economy looks like it’s still returning to a pretty steady equilibrium that looks a lot like pre-COVID. 2.5% growth. 2.5% inflation. Plenty of scary headlines. Being bearish is tiring.
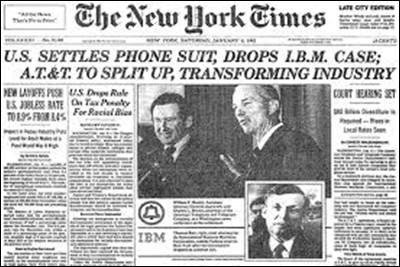
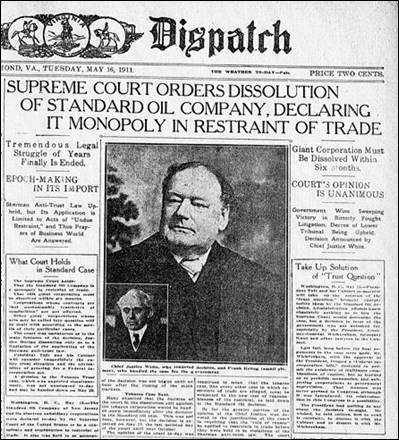
Finally, there was some angst around Google of late as they may be forced to breakup. This is probably not a valid reason to sell the stock. Shareholders of AT&T and Standard Oil did just fine post breakup. Here’s a good 1996 recap of how AT&T shareholders outperformed the market.
Here is this week’s 14-word stock market summary:
Stocks go boing. We all feel a bit stupider than we did in July.
Interest Rates
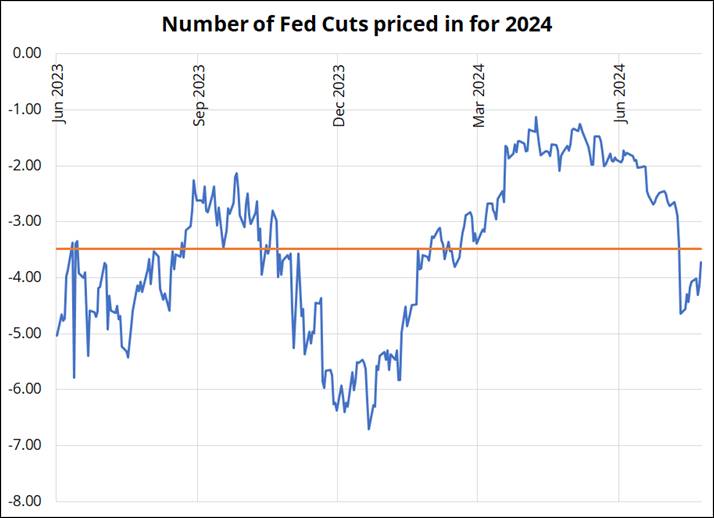
2024 has been the Year of Mean Reversion in interest rates as inflation slowwwly reverts toward the pre-COVID mean, US yields revert to the pre-GFC mean, and Fed expectations revert to the mean of the past 18 months. This next chart shows the evolution of Fed pricing from a few soft landing cuts to almost nothing in Q3 2023, then a full-on recession priced in January 2024, then nothing priced by April 2024 again. Now, we’re right back in the middle of the chart as summer wanes and the year end final stretch run is about to begin.
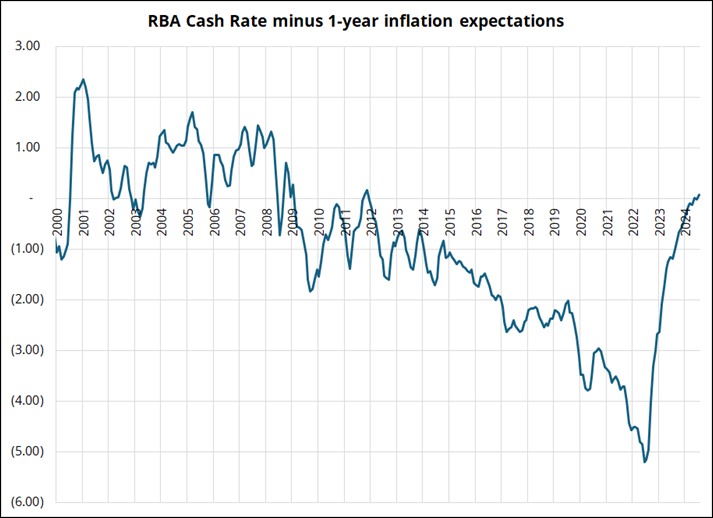
In New Zealand, the economic outlook is worse than the US. They are looking at falling inflation, falling growth, rising unemployment, and tight policy.
See tight policy here:
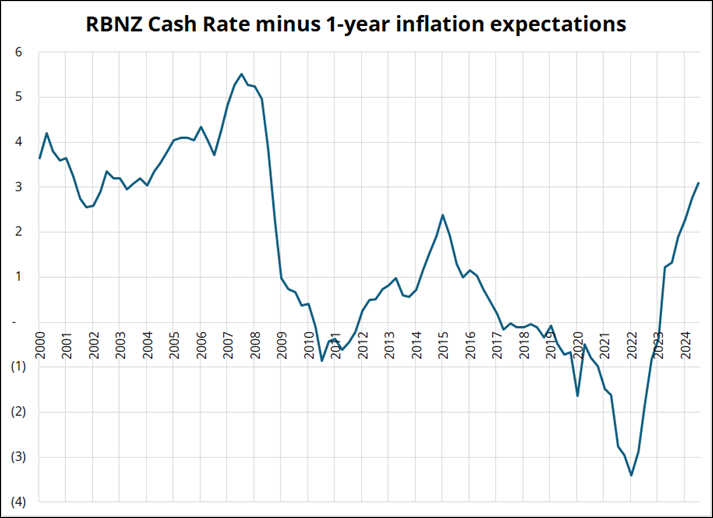
This is in contrast to Australia, where the cash rate is barely above inflation (i.e., policy is much looser in Oz than it is across the Tasman).
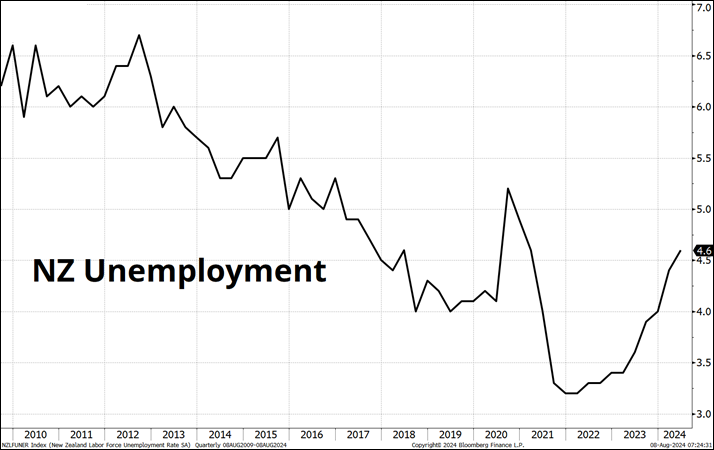
And here’s NZ unemployment:
In response, RBNZ Governor Adrian Orr cut rates this week, which was a mild, but not huge surprise. Countries where housing liabilities are not long-term fixed and consumer debt and leverage are high (i.e., NZ, UK, Canada, Sweden…) are seeing rate cuts. In the US, we haven’t seen any pain at all because mortgages tend to be fixed around the 30-year point and therefore rising rates have no short-term impact on existing mortgage holders. Yet.
Fiat Currencies
The RBNZ rate cut along with continuing stronger data in Australia triggered this move in AUDNZD this week.
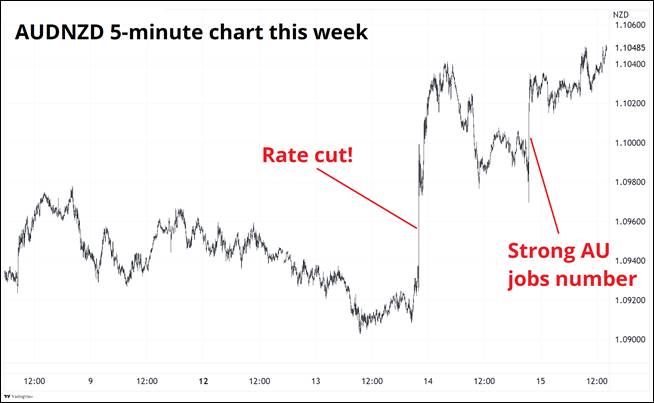
No self-respecting global macro trader takes a random currency pair like AUDNZD very seriously, but we FX traders absolutely love it! Relative value! Take out the USD risk! No correlation to equities!
Bigger picture, AUDNZD looks like this:
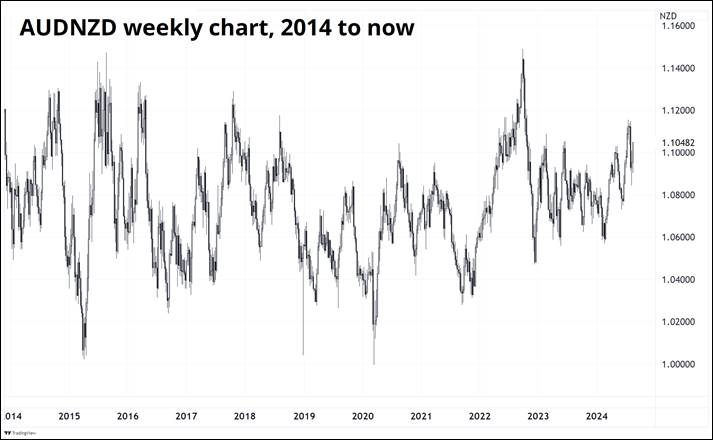
Ha!
For your reference, this is what an EKG readout looks like:

Buy low sell high. Jokes aside, that AUDNZD chart is a perfect example of a mean reverting time series in finance. There are specific ways to make money trading breakouts and trends and there are other ways to make money trading ranges. Knowing the flavor of your market can help you identify the correct regime for your trading and investing.
Crypto
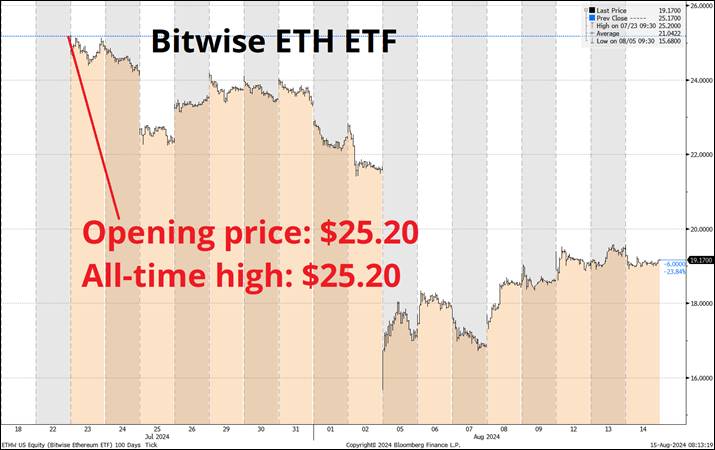
The spot bitcoin ETFs unleashed a new flood of demand for bitcoin, but it feels like we are now well past the peak of that most recent institutional adoption wave. ETH spot ETF buyers who jumped in at the open on day one have never been in the money, not even for 60 seconds. They are now 24% underwater and earning no yield for the privilege. Another one of the dozens of buy the rumor sell the fact moves in crypto.
I don’t find the limited supply = higher price arguments for bitcoin convincing because many financial instruments are in limited supply, including equities. In fact, bitcoin supply is rising while the supply of equities is falling. Sure, the falling supply of equities is not written in code, but it has been true for a long time!
Apple shares outstanding, for example, peaked in 2013 and have dropped 42 percent in a straight line over the past 11 years. Prices are determined by the interaction between supply and demand and if supply of BTC is perfectly known and basically static, then the price is only determined by changes in marginal demand. These changes in demand are dominated by the comings and goings of the institutional adoption story and the various hype cycles that grip and then let go of the crypto market every couple of years.
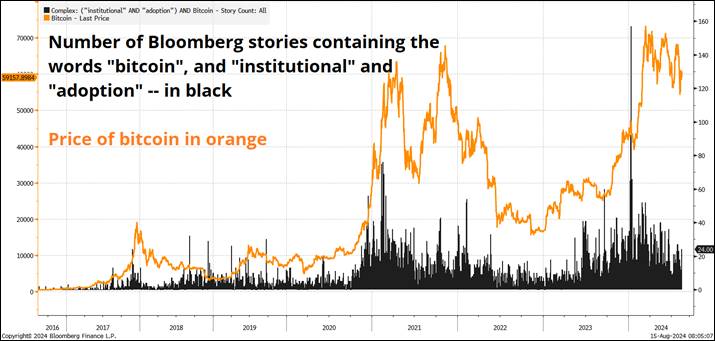
This next chart plots the number of Bloomberg stories mentioning institutional adoption of bitcoin along with the price of the coin. You can see the huge explosion in early 2021 as debasement worries grew and Bitcoin!™ went mainstream, then the massive spike in institutional interest when the spot ETFs launched in 2024.
Another way to look at this is by checking out the spot BTC ETF flows back to the January launch:
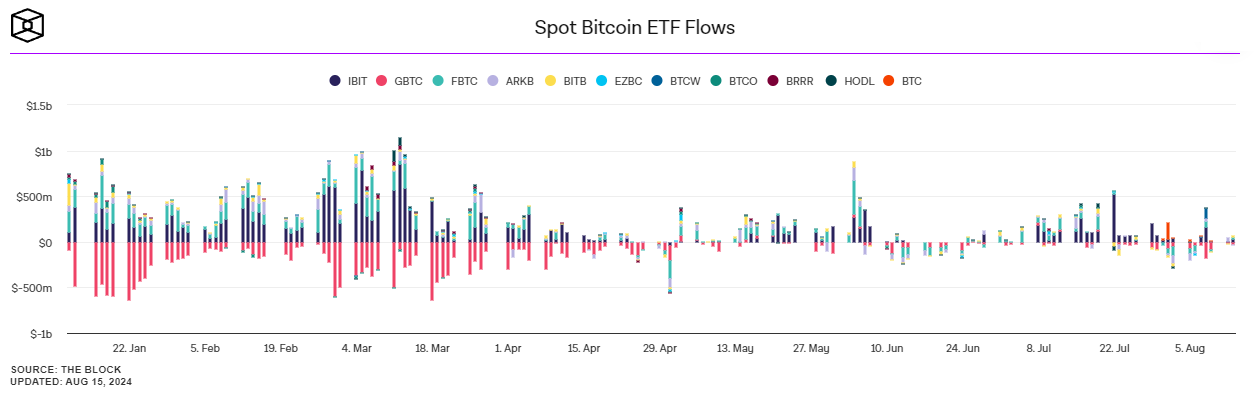
You can see that interest was there on launch, but it has petered out significantly as those that wanted the spot ETFs have now bought them, and the most recent hype cycle has lost its mojo. That last flurry of inflows at the start of June coincides with the final push and failure up at 70k. BTC has now made a series of lower highs after the false break of the 69k ATH in 2021.
Zooming out, I have concerns.
[if !supportLists]a. [endif]There are not many crypto products left for Wall Street to launch. We got the futures, then the futures ETF, then the spot ETF for BTC, and the spot ETH ETF. What’s next? I am certain that a spot SOL ETF is not going to matter for anything other than a nice buy rumor / sell fact trade in SOL. Pension funds aren’t going long Solana any time soon. Options on the spot ETFs will be an exciting new plaything for punters and market makers, but are unlikely to drive incremental demand for the coins themselves.
[if !supportLists]b. [endif]While the NASDAQ trades 19% above its 2021 peak, bitcoin trades 14% below its 2021 peak. That is, piling into NASDAQ at the highs in 2021 was a better bet than piling into crypto at the highs at that same time. Then again, piling into ARKK was worse.
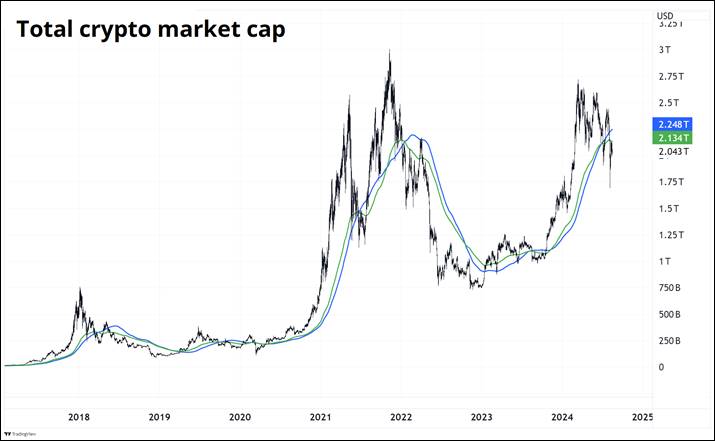
[if !supportLists]c. [endif]In the 2024 bull cycle, as bitcoin made a new all-time high, total crypto market cap did not (see next chart). The Web3 or cryptogaming or blockchain revolution stories are not playing out so far in terms of crypto market cap. At all. See MANA, SAND, AXI, etc. There are plenty of bright lights like SOL and WIF, but overall crypto market cap stalled before making new highs and has now declined significantly.
Looking purely at crypto as an investment or tradeable asset, it’s not obvious to me what the next big catalyst will be. The asset class has been fully financialized and fully embraced by those in the mainstream that have an interest, and while there is no doubt that institutional adoption is taking place, it’s not helping the price.
I am not an expert on crypto, but when I look at the state of the crypto market from 30,000 feet, it looks played out for now. All the juicy price gains have accrued to the early adopters or the canny buy-the-dippers and maybe crypto is just dead money for a while. Perhaps the next catalyst will be central bank adoption? I’m not sure. Any ideas?
I am open to feedback on this as I do not claim to know all there is to know about crypto or BTC.
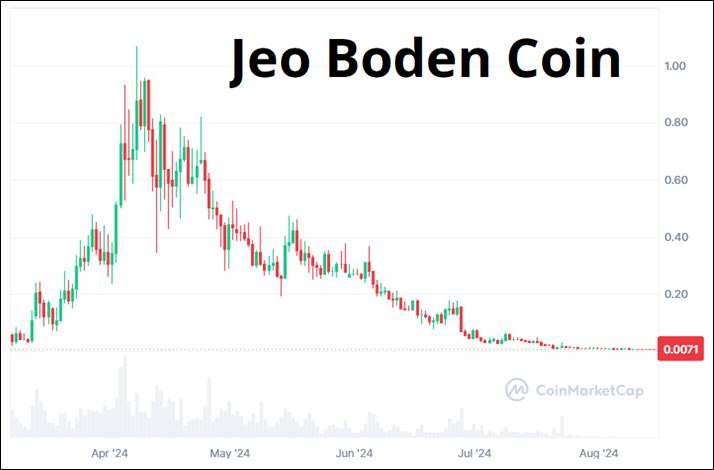
Finally, here’s a pretty good foreshadowing of what I think will happen to NASDAQ: DJT…

Commodities
For the first time in a while, there are some green shoots in commodities!

And while I keep pooh-poohing gold every week, it continues to float along right up at the all-time highs. For a thing that nobody is talking about and China stopped buying, it’s remarkably stable and elevated. Even silver had an OK this week, though I have come to think of most commodity moves as majority noise and minority signal these days as oil, gold, silver, and anything non-agricultural has just been bobbing around like an offshore Pepsi bottle. Narratives and trends are minimal in the commodities that people normally watch for cross-market correlation and financial trading.
Whew! OK! That was 10.25 minutes. Thanks for reading Friday Speedrun.
Get rich or have fun trying.
Links of the week
smart. Interesting, poetic
Analyst Rating Improvers: A Bet on Turnaround Companies
This paper is a simple and logical study in why the first derivative of analyst opinion matters more than the level or direction of analyst opinion.
Why bronze medal winners are happier than silver medal winners
Abstract: Research on counterfactual thinking has shown that people's emotional responses to events are influenced by their thoughts about "what might have been." The authors extend these findings by documenting a familiar occasion in which those who are objectively better off nonetheless feel worse. In particular, an analysis of the emotional reactions of bronze and silver medalists at the 1992 Summer Olympics—both at the conclusion of their events and on the medal stand—indicates that bronze medalists tend to be happier than silver medalists. The authors attribute these results to the fact that the most compelling counterfactual alternative for the silver medalist is winning the gold, whereas for the bronze medalist it is finishing without a medal. Support for this interpretation was obtained from the 1992 Olympics and the 1994 Empire State Games. The discussion focuses on the implications of endowment and contrast for well-being.
“A Smile to Remember”, poem by Charles Bukowski
we had goldfish and they circled around and around
in the bowl on the table near the heavy drapes
covering the picture window and
my mother, always smiling, wanting us all
to be happy, told me, "be happy Henry!"
and she was right: it's better to be happy if you can
but my father continued to beat her and me several times a week while
raging inside his 6-foot-two frame because he couldn't
understand what was attacking him from within.
my mother, poor fish,
wanting to be happy, beaten two or three times a
week, telling me to be happy: "Henry, smile!
why don't you ever smile?"
and then she would smile, to show me how, and it was the
saddest smile I ever saw
one day the goldfish died, all five of them,
they floated on the water, on their sides, their
eyes still open,
and when my father got home he threw them to the cat
there on the kitchen floor and we watched as my mother
smiled

https://www.newyorker.com/magazine/2005/03/14/smashed
Thanks for reading this week’s Speedrun. Feedback and criticism are always welcome.
Subscribe to Friday Speedrun here (free)
Spectra Markets is affiliated with Spectra FX Solutions LLC, an introducing broker that is registered with the NFA; Spectra FX Solutions LLP, which is a registered entity with the U.K.’s Financial Conduct Authority; and SpectrAxe, LLC, a swap execution facility that is registered with the CFTC.. The disclosures for Spectra FX Solutions LLC and Spectra FX Solutions LLP related to the separate businesses of Spectra FX can be found at https://link.edgepilot.com/s/3ff61bec/-vXFgOrOgkKksWjUmhyMrg?u=http://www.spectrafx.com/.
“We do not consider that this commentary constitutes “research” or “investment research” (together “Research”) as described in Commission Delegated Directive (EU) 2017/593 (“MiFID Delegated Directive”) or referred to in Directive 2014/65/EU (“MiFID II”). However, each recipient remains responsible for determining whether this communication constitutes research and therefore if there are any restrictions on their receipt or use of this communication for the purposes of the MiFID Delegated Directive, MiFID II or otherwise.
Unsubscribe from this author